For a birding outing tonight or tomorrow morning in the contiguous United States, use BirdCast to assess migration aloft, then use recent local observations and habitat to choose where to watch. For a particular species or a trip planned weeks ahead, use eBird’s seasonal maps. For a tracked bird’s journey, use Audubon’s Migration Explorer.
A map can show heavy migration overnight while your morning walk stays quiet. The birds may have flown past, landed in another habitat, or replaced birds that left. Knowing what each map measures tells you which of those happened.
Which Bird Migration Map Should You Use?
Pick the map by the decision in front of you. A trip months away calls for seasonal data, tonight’s flight calls for a forecast or radar, and a report of birds in a park calls for dated field checklists.
| Your question | Best-fit tool | What the display provides |
|---|---|---|
| Will migration be busy tonight or on one of the next nights? | BirdCast forecast | Predicted nighttime activity in the air |
| Are birds moving overhead tonight? | BirdCast live map | Radar-estimated flight traffic and movement direction |
| What passed over my county last night? | BirdCast Migration Dashboard | Estimated local crossings and flight measurements |
| When is a particular species present in a region? | eBird Status and Trends (example species map) | Modeled weekly relative abundance for a species |
| What have birders seen near my destination? | eBird Explore and Hotspots | Dated observations and checklists from people in the field |
| Where have individually tracked birds traveled? | Audubon Bird Migration Explorer | Contributed tracking routes and movement information |
For a spring trip to Port Aransas, Texas, you can compare the weeks when your target species tend to be present while you plan far ahead. Closer to departure, BirdCast’s short-range outlook takes over.
BirdCast’s radar products track nocturnal movement in the contiguous United States only. There is no equivalent radar map for Alaska or Hawaii.
How Do You Read BirdCast Colors, Arrows, and Traffic Rates?
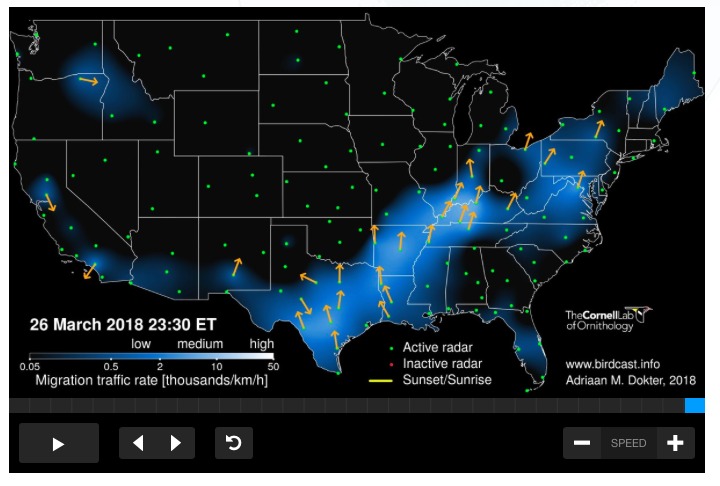
The forecast and the live map measure different things. The forecast estimates bird density in active flight, in birds per square kilometer (birds/km²), about three hours after local sunset. The live map estimates migration traffic rate (MTR), in birds per kilometer per hour (birds/km/hour). To compare radar forecasts, migration intensity, and weather together, see how to read birdcast migration forecasts.
That is why two maps can disagree on the same night. The forecast counts birds in the air at one moment. The live map counts birds crossing a line each hour. Neither tells you how many birds are sitting in the woods near you.
What a live-map color represents
Higher-intensity colors mean a stronger migration traffic rate. MTR is the number of birds estimated to cross a one-kilometer line, perpendicular to their direction of travel, within one hour.
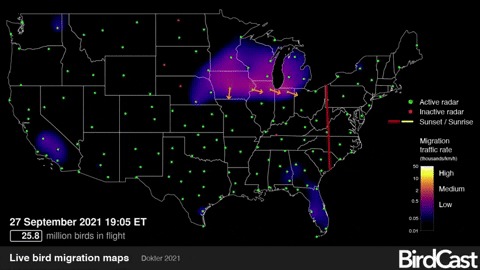
- Orange arrows: the direction birds are traveling toward.
- Red and yellow lines: the locations of sunset and sunrise across the map.
- Green and red radar dots: radar sites marked active or inactive.
- Grayscale and outlined areas on forecasts: weather information, including predicted precipitation, read through that forecast’s legend.
BirdCast forecasts update about every six hours. Cornell’s April 2026 guide puts live-map updates at roughly every ten minutes on active nights. The forecast shows one moment after sunset, while the live display follows detected movement through the night.
Live-map graphics use Eastern Time, while county and state dashboard charts use the selected area’s local time. Check the clock before you compare screenshots.
Which Counts Does the BirdCast Migration Dashboard Report?
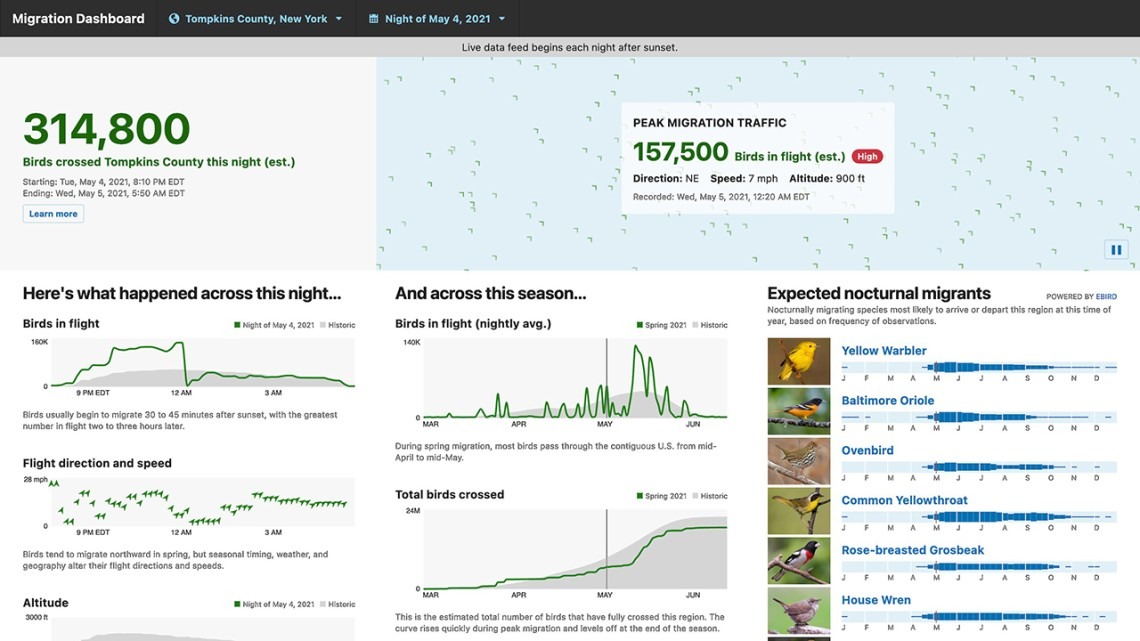
The local dashboard covers one county or state, and every figure on it is an estimate. The nightly total and the count of birds currently aloft answer different questions.
| Dashboard component | Meaning |
|---|---|
| Birds Crossed This Night | Birds that crossed the selected region during the night, accumulated for that night |
| Peak Migration Traffic | Birds aloft at the night’s peak moment |
| Birds in Flight chart | Airborne movement plotted through the night, with historical context |
| Flight direction and ground speed | Travel direction and speed relative to the ground, influenced by wind |
| Altitude Above Ground | Flight height in feet above ground |
| Total Birds Crossed | Cumulative crossings for the migration season, season to date |
The count of birds aloft can exceed the nightly crossing total when birds are still inside the region and haven’t finished passing through. Speed or altitude can be unavailable during low traffic or interfering weather.
BirdCast gives a wind example: a bird flying at 50 km/h through the air moves at 75 km/h over the ground with a 25 km/h tailwind. Against an equally strong headwind, its ground speed drops to 25 km/h.
Why Is a Bird Migration Map Blank or Patchy?
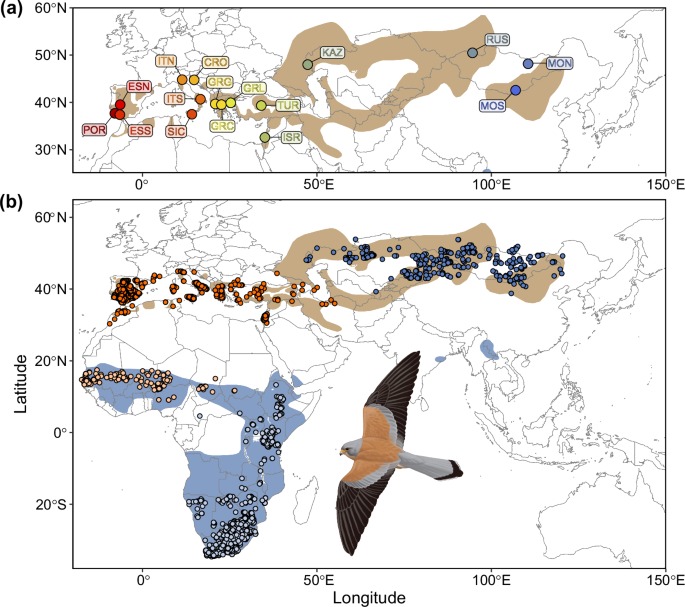
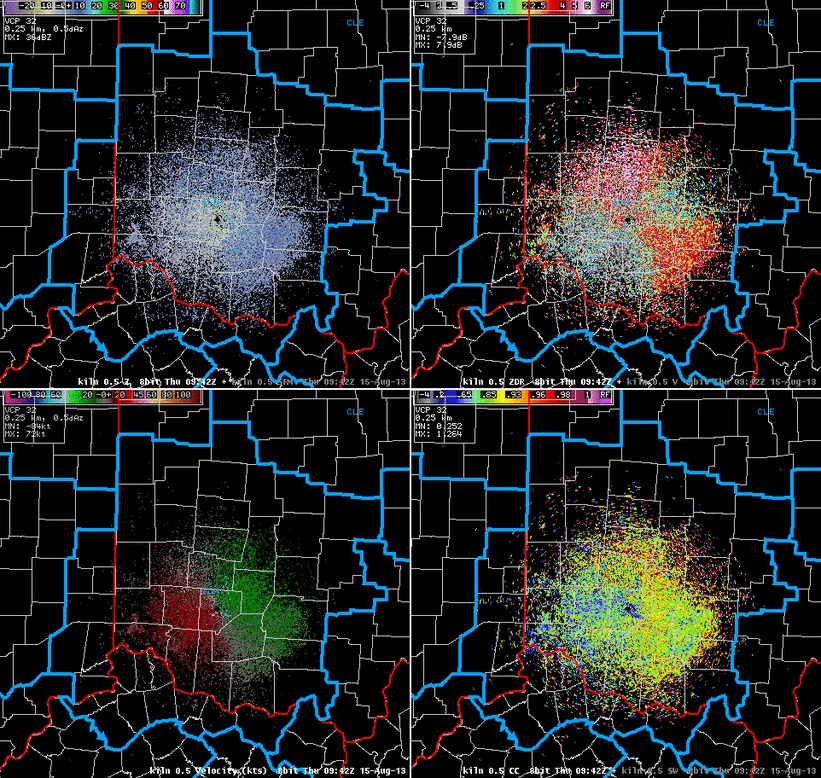
An empty-looking map can mean quiet activity, unavailable data, or a problem with the selected time or radar coverage.
BirdCast’s dashboard documentation lists spring operation from March 1 through June 15 and fall operation from August 1 through November 15, generally from local sunset to sunrise. Historical night views remain useful outside those periods, and birds can migrate outside them too.
| What appears | Possible cause | How to distinguish it |
|---|---|---|
| Very little color | Low measured traffic or a time without an active reading | Read the activity value and data-status label separately |
| A gap near a radar station | Inactive site, maintenance, or radar geometry | Look for active/inactive radar markers |
| Patchy coverage during rain | Precipitation interfering with bird detection | Compare the relevant weather overlay |
| Missing speed or altitude | Insufficient usable traffic measurement | Treat the field as missing data |
| A county gives no result | Season, historical-date selection, coverage, or service interruption | Inspect the selected location and product availability |
Mountain terrain and radar geometry limit what the equipment can see. Birds may move below the effective radar beam, and altitude readings carry extra uncertainty there.
The interface can also fail. On August 28, 2025, a participant in r/birding described being unable to retrieve a dashboard result despite using the tool regularly:
I noticed that the BirdCast Migration Dashboard, which is run by Cornell University and shows bird migration traffic in a given area, is not working today. I cannot get migration information on my county or any other county or state that I have tried to input. This is the first time it hasn’t worked for me. I use this tool multiple times per week to determine when and where to go birding.
This is one user’s report on one date, and the post doesn’t give a cause.
If the interface fails, try a historical view or another suitable product.
Can a Migration Map Identify Which Birds Are Overhead?

Weather radar measures airborne movement, not species. BirdCast’s experimental Expected Nocturnal Migrants list uses a separate eBird-informed analysis of seasonal occurrence to suggest possible species.
The list draws on local bird-observation patterns and can be unavailable where data is thin. It covers nocturnal migrants, so birds that migrate by day, including many raptors and swallows, are largely outside its scope.
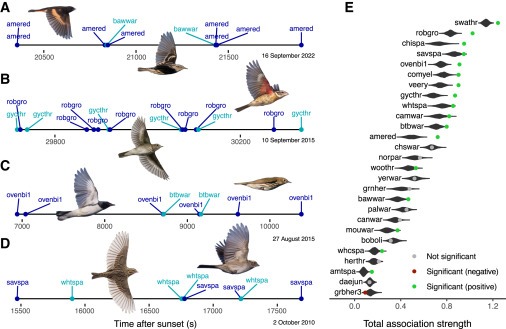
Strong radar activity over Oklahoma on a spring night means birds are moving through the area. If you see a Scissor-tailed Flycatcher, warbler, or thrush the next morning, you identify it from what you see and hear then.
For species-level expectations, compare the time of year with seasonal distribution and recent local checklists.
How Can You Use a Migration Map for Tomorrow Morning’s Birding?
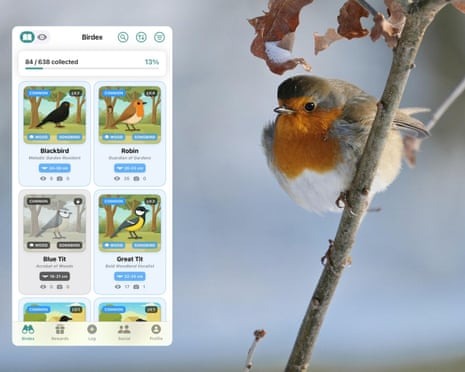
Use the previous night’s migration signal to decide whether an outing is worth it, then weigh local weather, habitat, and dated sightings to pick a destination.
- Assess the night: Use the forecast before migration begins, or a historical dashboard record afterward, to see how much regional movement there was.
- Consider conditions and habitat: A rain front can interrupt flight and bring migrants down. Think about which nearby habitat could hold them.
- Read local observations: Recent eBird checklists show which birds people reported nearby. Note the dates and how many observers covered the area.
- Make the outing: Go where the species and conditions fit, and record what you find.

Why a busy migration night can produce a quiet count
Nussbaumer and colleagues combined weather radar and eBird data in a 2024 Ecography study of estimated nightly turnover in urban areas over the 2010 to 2021 period. Mean estimated daily turnover was about 13%, with peak nights approaching 40 to 50%.
Birds arrive as others depart, so the mix of species can change a lot while the number seen on the ground barely moves.
A woodland that seems no busier than yesterday may still hold new migrants. Check for new species instead of expecting the total to surge after a busy night on radar.
How Do eBird Species Maps and Tracked-Bird Routes Differ?
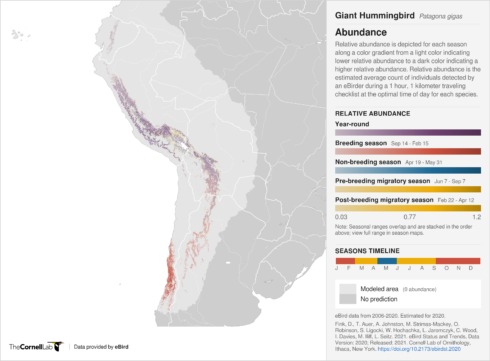
eBird Status and Trends models where a species occurs across the weeks of the year. Audubon’s Migration Explorer uses contributed tracking data to show routes of individually tracked birds. Observer checklists add a third kind of evidence: dated sightings by people. To weigh sighting notes, species uncertainty, and eBird checklists, see how to record a bird sighting reliably.
For eBird’s weekly maps, relative abundance is the expected average number of individuals detected on a standardized one-hour, two-kilometer traveling checklist at the species’ optimal time of day.
| Information source | Decision it supports | Important boundary |
|---|---|---|
| eBird weekly relative abundance | Compare a species’ modeled occurrence across weeks and regions | Standardized statistical estimate |
| eBird Explore and Hotspots | Find actual recorded observations at a place | Reporting dates and observer effort affect coverage |
| Audubon Bird Migration Explorer | Study pathways documented through tracking projects | Selected birds and studies, with positional uncertainty and smoothed routes |
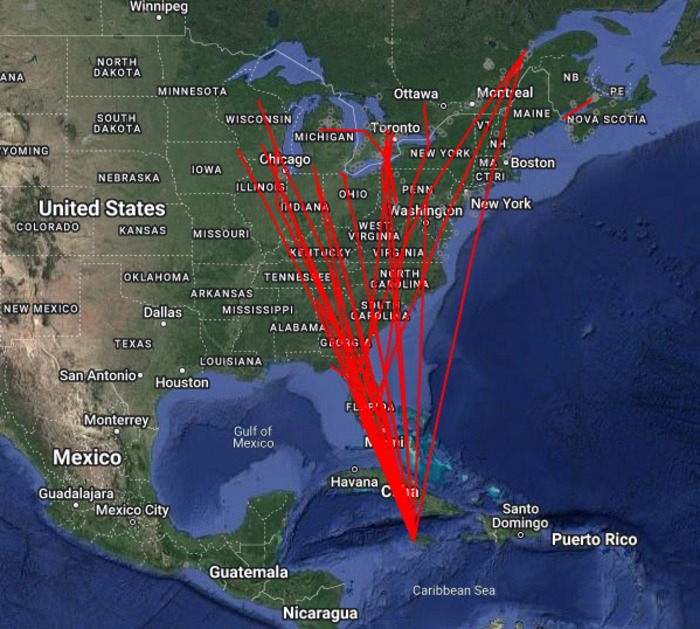
A route line in a tracking view comes from contributed records and how they were processed. Devices differ in positional precision, and gaps or smoothing can simplify a displayed route. Read the line as evidence about those tracked individuals. Conclusions about a whole species need more data.
How Reliable Are Bird Migration Forecasts?
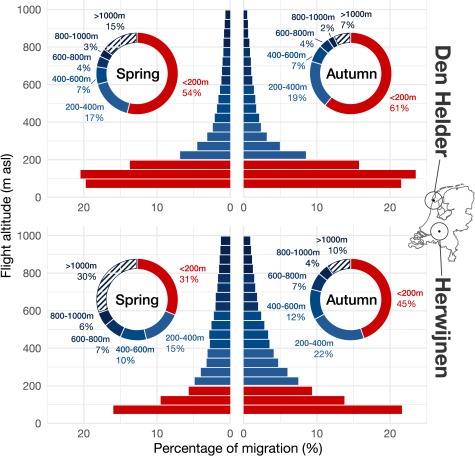
Bird migration forecasts are scientifically grounded models of airborne movement.
Van Doren and Horton analyzed 23 years of spring radar observations in a 2018 study published in Science (DOI: 10.1126/science.aat7526). Their models explained up to 81% of variation in migration intensity. Historical tests at lead times of one to seven days explained 62 to 76%. The study covered birds flying at altitudes from 0 to 3,000 meters.
These percentages show how closely the models matched past migration intensity. They don’t give the odds of seeing a specific bird tomorrow.

A strong radar signal over a broad region can produce very different results at different habitats. For seasonal travel planning, a species’ weekly distribution map still works when there is no live nighttime radar frame.
How Can Migration Forecasts Help Protect Birds?

BirdCast and Cornell recommend reducing nonessential outdoor lights during migration and making windows safer against collisions. Safety-required lighting should stay on. For migration timing, flyways, and habitat, the bird migration guide goes further.