Check BirdCast’s three-night forecast to see when migration is expected over your part of the US, then use the live map and your county dashboard to follow what actually flies. Go birding the next morning if the weather is safe, the habitat is good and recent local reports show migrants on the ground. Check local conditions before you travel. On active migration nights, switch off nonessential outdoor lights and keep the ones you need for safety.
Which BirdCast tool should you open first?
BirdCast’s maps and dashboards look alike but answer two different questions: what is expected on a coming night, and what radar has already measured.
Start with the official BirdCast Migration Forecast Maps to decide what to expect tonight, tomorrow night or the night after. The forecast updates every six hours and shows predicted airborne activity about three hours after local sunset for each night. The three-night display shows selected forecast times.
| BirdCast tool | When to use it | What it shows | What you decide |
|---|---|---|---|
| Forecast Maps | Before a migration night | Predicted migration density in the air | Which approaching night deserves attention |
| Local Migration Alerts | Before a night | Predicted nightly movement compared with local seasonal history | Whether the night is unusually active for your area |
| Live Maps | During the night | Radar-derived movement rate and direction | Whether migrants are moving overhead |
| Migration Dashboard | During or after a night | Regional counts, movement characteristics and historical views | What passed over a given county or state |
Say it’s Wednesday afternoon and you want to bird Friday morning. Thursday night’s forecast is the one to read, because the live map can’t show Thursday’s movement yet. Once birds are flying, the live map shows it as it happens. By Friday morning, the county dashboard shows how the night went.
The main live tools cover the contiguous United States and run during migration seasons. Historical dashboard records stay useful outside live-feed periods. BirdCast redesigned its website in March 2026, so match product names rather than layouts when you follow older screenshots.
For other migration visualizations, see how different bird migration maps are used.
How to read the migration forecast colors and rain overlay
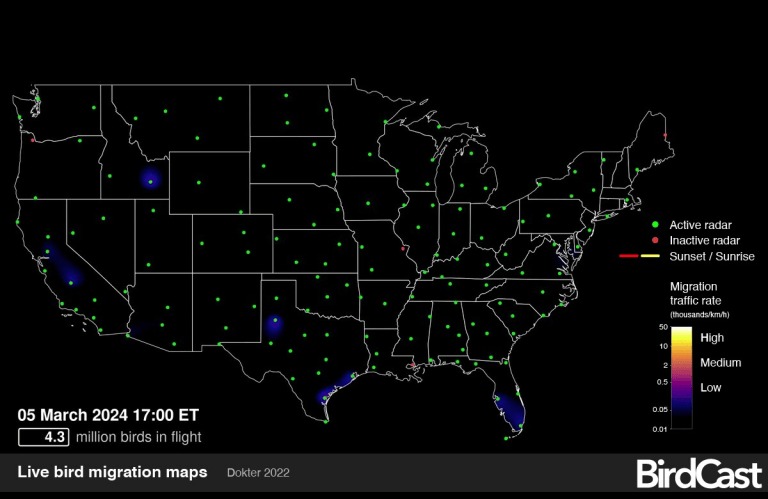
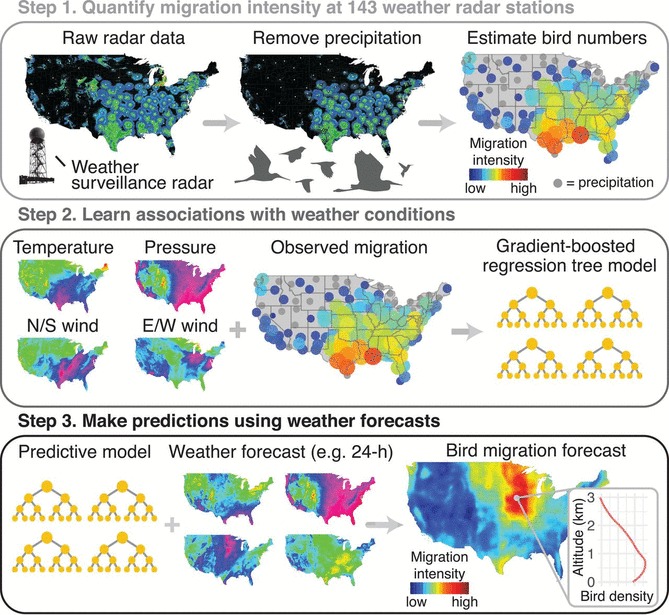
Warmer, brighter colors mean more intense predicted migration in the air. The shading models bird activity for the selected night and forecast time. Gray shading and weather outlines show precipitation, including places where rain and migration overlap. For timing, flyways and habitat, cross-check with the bird migration guide.
Read the date, the sunset-relative forecast time and the legend first. Then look at where migration shading meets rain. Weather affects whether birds depart, keep flying or break a flight, so a rain band crossing intense migration is worth a close look. Its timing and strength can change how the birds move.
BirdCast also treats overlapping rain and heavy migration as a conservation concern. Artificial light at night can disorient migrants and raise collision risk when weather complicates their flight.
Take a forecast with strong migration across the Midwest and a gray rain band crossing one edge of the colored region. The map shows heavy movement and weather that could interrupt it. Whether birds settle in a woodland, stay aloft or fly past the rain depends on how the night develops.
BirdCast units: birds/km², birds/km/hour and birds/km/night
BirdCast uses three measurements: birds occupying airspace, birds crossing a line in an hour, and crossings added up over a night. The denominator tells you what each number means.
| Display or measurement | Unit | What it estimates | Time basis |
|---|---|---|---|
| Forecast migration density | birds/km² | Predicted birds aloft above a 1 km × 1 km ground area | A forecast snapshot |
| Live migration traffic rate (MTR) | birds/km/hour | Estimated birds crossing a one-kilometer line perpendicular to flight | Per hour |
| Local migration alert traffic | birds/km/night | Predicted crossings of a one-kilometer line | Over a night |
| Dashboard birds crossed | birds | Estimated birds that crossed the selected region | Cumulative nighttime total |
| Dashboard birds in flight | birds | Estimated birds aloft over the selected region at a sampled moment | Instantaneous or peak estimate |
Take a square kilometer of land under migrating birds. Forecast density is how many birds are expected in the air above that square at the forecast time. Now draw a one-kilometer line across their direction of travel. Live traffic rate is the number of birds crossing it per hour, and nightly traffic adds those crossings up over the observation period.
Traffic rate depends on how fast birds move through the air, ground speed included. Density counts birds aloft at one moment. Compare numbers only within the same measurement and time frame.
BirdCast’s 2020 color-scale note explained that forecast and live products can use similar palettes for different units. Read a yellow patch on either map against that map’s own legend and unit label.
National intensity and local rank are different things. A region that looks modest next to the Gulf Coast can still have an unusually active night for its own season. BirdCast defines a high local migration alert as a predicted night in the top 10% of that location’s seasonal migration nights. A medium alert is roughly the 70th to 90th percentile. Two regions with very different absolute movement can both get high alerts.
People who use the data for specialized work ask how precise the numbers are. One Reddit contributor wanted to record nocturnal flight calls:
Cornell runs a BirdCast and has some pretty refined numbers, capable of listing numbers of birds by the hundred. Is this really feasible, with only 143 radar stations reporting data nationwide? Does radar count bigger birds more than smaller birds, etc? Is there some guesswork here? I am trying to use this tool to record nocturnal flight calls of migrating birds, and want to get your perspective on just how accurate radar tech actually is. Thanks!
BirdCast’s spring 2026 seasonal recap reports processing observations from 143 NOAA WSR-88D weather-radar stations. Its seasonal detection total sums nightly peak estimates, so one bird can count on several nights.
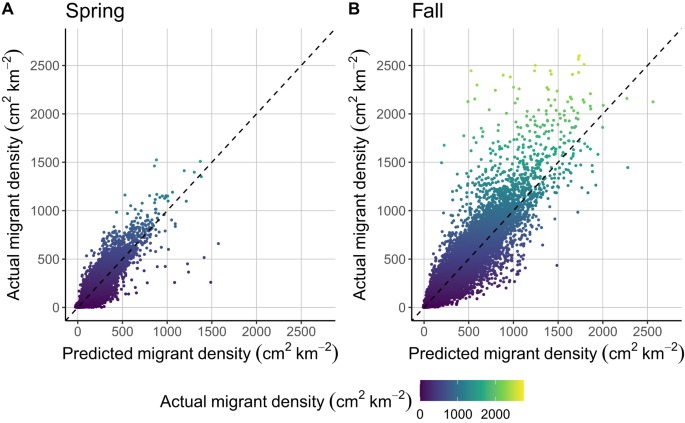
A 2018 Science study by Benjamin Van Doren and Kyle Horton tested forecasting against 23 years of spring observations. The historical model explained up to 81% of variation in migration intensity across 0 to 3,000 meters, and 62% to 76% in its one- to seven-day forecast evaluation. Those figures measure model performance, not your odds of seeing birds on a given outing.
Follow the night with the live map and local dashboard
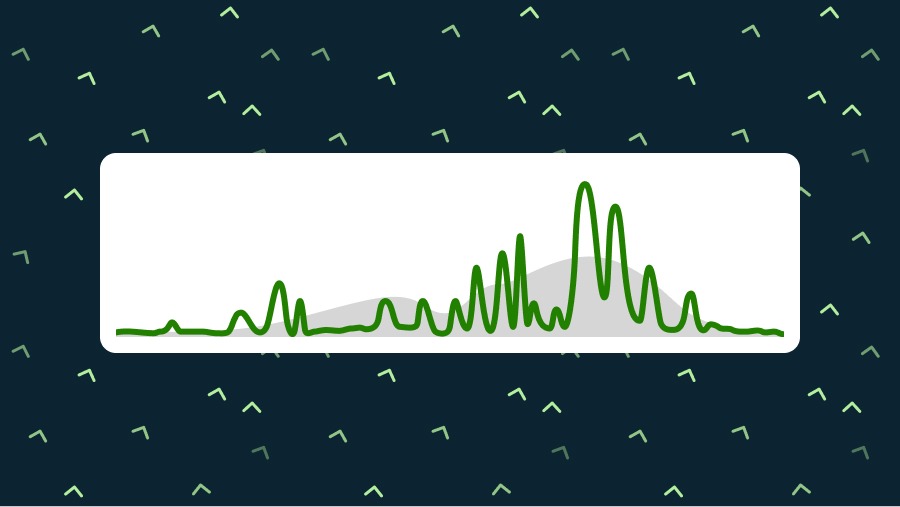
Once migration starts, the BirdCast Live Maps show radar-derived movement across the country. Traffic measurements estimate how birds move through the air, and arrows show flight direction. Sunset and sunrise lines mark the nighttime observation period when displayed.
Cornell’s April 2026 walkthrough describes live updates about every ten minutes, while forecasts refresh every six hours.
For a regional account, open the BirdCast Migration Dashboard, pick a state or county and choose a date. Its fields cover different parts of the night:
- Birds crossed this night: the estimated number of birds that traversed the selected area during the night.
- Birds in flight: the estimated number aloft over that area at a sampled time, with peak values when available.
- Direction and speed: the general direction of detected migration and its ground speed, which reflects both the birds and the wind.
- Flight altitude: the estimated mean height of migrants.
- Nightly and seasonal plots: when movement happened and how it compares with the region’s history.
The two big counters differ because birds aloft at a sampled moment include some that haven’t yet finished the crossing counted in the cumulative total.
Live-map graphics use Eastern Time, and dashboard charts use the selected region’s local time. Keep that in mind when you compare a live-map frame with a county’s movement curve.
On the historical Kings County, California dashboard for November 8 to 9, 2026, the record shows an estimated 99,100 birds crossed and 127,200 birds in flight at the sampled peak. It also shows SSE movement, about 24 mph ground speed and about 800 feet mean flight altitude at the November 9, 6:30 AM PST observation.
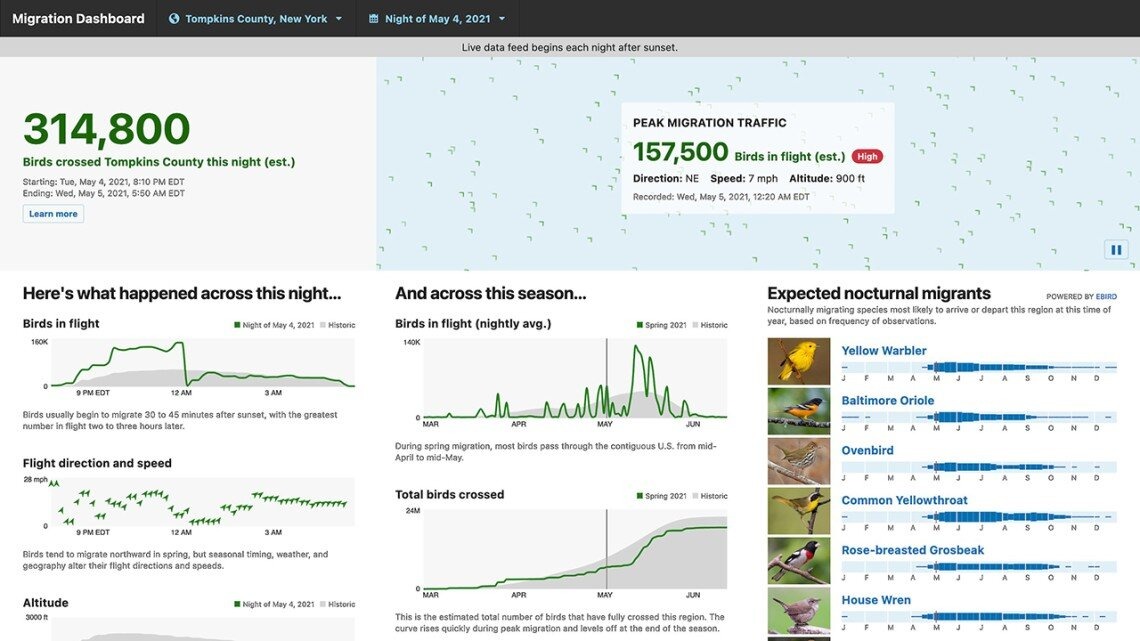
The nightly curve shows whether movement bunched into part of the night or spread over several hours. Direction, speed and altitude appear when the radar data are reliable enough.
Which species might be moving?
BirdCast’s radar estimates airborne migration without identifying species. The dashboard’s Expected nocturnal migrants panel uses eBird occurrence frequencies for the selected region and time of year to suggest which species may be passing through.
The list is an experimental seasonal aid and focuses on nocturnal migrants. Many daytime migrants, including numerous raptors and swallows, fall outside it.
One Reddit user hit a confusing empty state when the dashboard showed a county traffic estimate but no species list:
Fall migration technically started on August 1st but BirdCast isn’t working right for me. It shows the estimate of how many birds crossed the county last night but it’s not showing the species. Instead of the species list it says, “Expected migrants cannot be reliably determined for this region on this night.” Is this happening to anyone else or is this a me issue?
When a region and period have too few suitable eBird observations, BirdCast can’t build a reliable list. The radar estimate and the eBird-based panel have different data requirements.
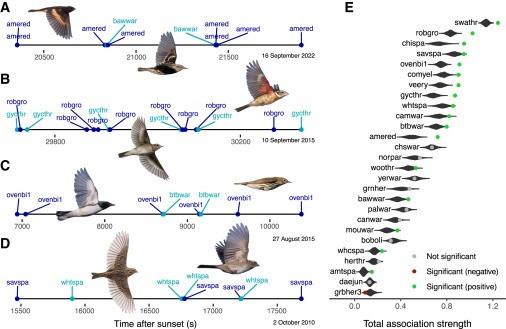
The calculation looks at how often a species appears in local eBird records and how that frequency shifts through the season. Species recorded steadily all year, and birds with sparse regional reports, are harder to read as seasonal nocturnal migrants.
To identify species, rely on birds you see or hear, the habitat and recent local reports. The panel narrows the field to plausible species before you go.
Does a high forecast mean good birding tomorrow?

A high overnight forecast tells you when birds are moving. Where they land depends on weather and habitat.
Nocturnal migrants often fly above the range of ordinary ground observation. BirdCast’s FAQ gives typical average migration heights above 350 meters for the contiguous United States. Birds can cross a county at night and continue to another stopping place. For flyways and timing, see why do some birds migrate at night.
Birders who watch high estimates without seeing more local birds know this well:
I live along a major migration corridor; currently I am seeing ‘high’ migration counts happening for my region. While I know these estimates are for overnight migration, some of the birdies ought to stay back (for whatever reasons). How would one go about using this data to spot birds in migration? I don’t see a necessary increase in endemic birds common to other regions in the submitted lists?! What gives? Feedback appreciated!
A region can have heavy overhead traffic while one park sees few new arrivals. Stopovers depend on weather, habitat, food and whether birds need to pause.
Rain can interrupt migration and sometimes pushes birds down into suitable habitat. Its timing, intensity and location decide whether that matters on a given morning. Postpone for storms or hazardous access, whatever the forecast says about migrant numbers.
| Forecast and local situation | What it tells you | What to do |
|---|---|---|
| Locally high forecast, accessible habitat and safe weather | An unusually active local migration night is predicted | Pick a local site after checking actual conditions |
| Intense forecast migration meeting rain | Weather may change flight and stopover patterns | Stay out of hazardous weather and look for suitable habitat nearby |
| Heavy overnight traffic with little change in local sightings | Birds may have flown on over the region | Check reporting coverage, habitat and what observers see on the ground |
Say the county dashboard shows heavy overnight traffic and the weather has cleared. A nearby woodland with good habitat is a better destination than a spot picked because it sat under bright forecast shading. Recent sighting reports show whether migrants have turned up near the site.
To find accessible habitat, start with nearby birding hotspots.
When BirdCast looks blank or inconsistent
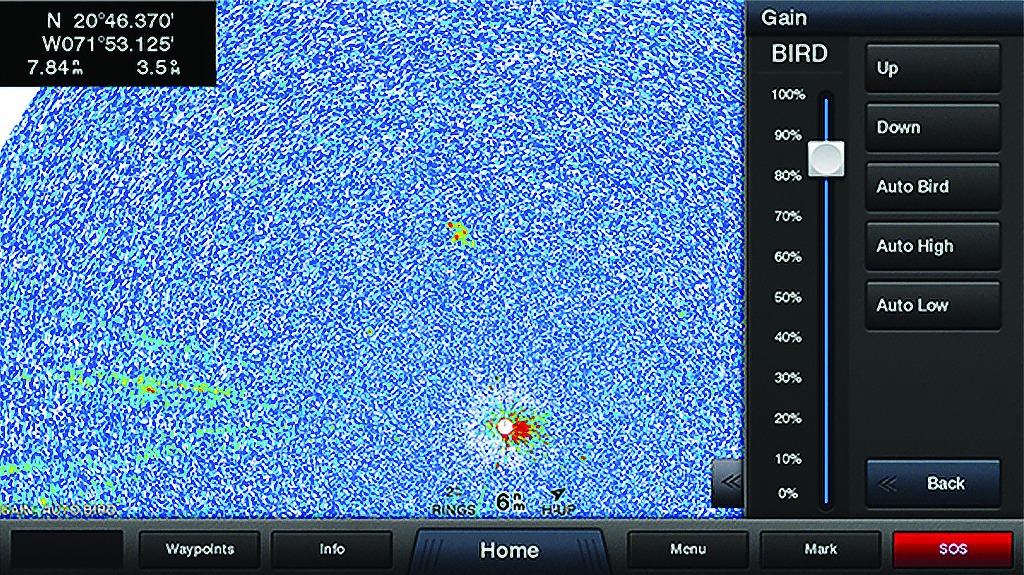
A blank area or a mismatch between BirdCast displays usually comes down to the date, the live-feed schedule, radar coverage, data quality or the unit shown. Start by checking which product and time period are on screen.
| What you see | Why | What to check |
|---|---|---|
| No live movement during daytime | Live products cover sunset to sunrise | Check the selected mode and observation period |
| No current dashboard feed outside the migration season | The documented live feed runs March 1 to June 15 and August 1 to November 15 | Choose an archived date to view an earlier night |
| Missing geographic radar tiles | Radar maintenance, outages or terrain can limit coverage | Green station dots mean radar data is available; red dots mean it isn’t |
| Missing or unreliable altitude, speed or direction | Sparse traffic, precipitation or insects reduce reliability | Tell an unavailable estimate from an explicit zero |
| Forecast and live map disagree | They describe different times and different quantities | Compare the selected date, area and displayed unit |
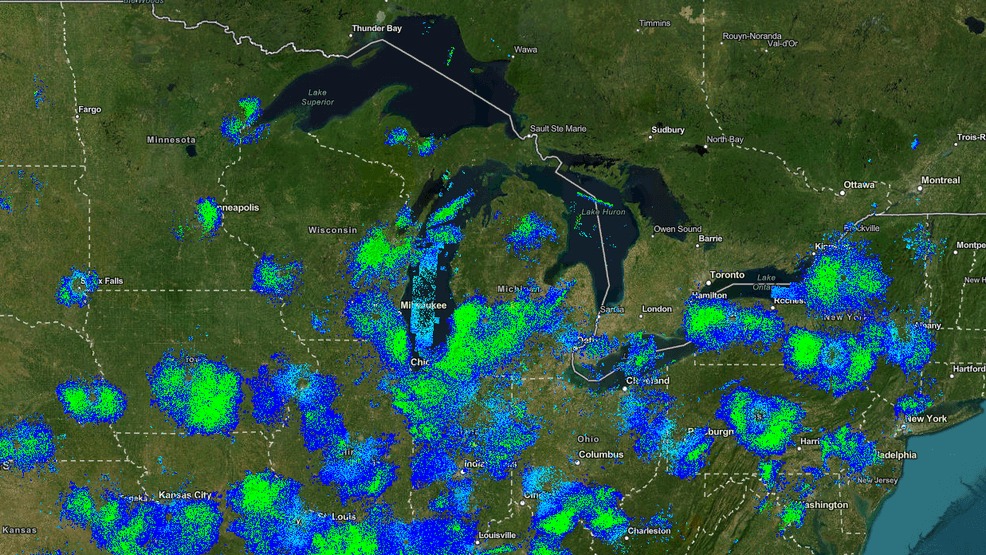
Mountainous terrain can make radar beams pass above birds flying at lower elevations. Rain and occasional insects also make it harder to separate birds from other radar returns.
For other missing measurements, check the data-quality indicators and BirdCast’s tool documentation.
Use local alerts and protect night migrants
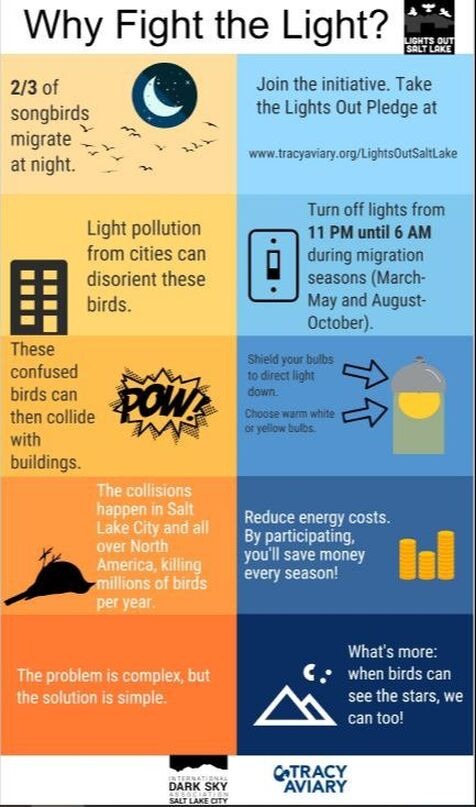
BirdCast reports that roughly 10% of seasonal migration nights carry about 50% of migration traffic, so locally active nights are the best time to protect birds.
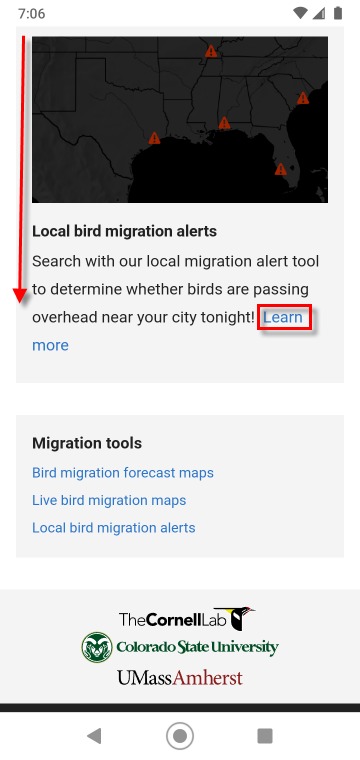
To get BirdCast Local Migration Alerts, choose your region and a nearby listed city, enter your email address and confirm the subscription.
During BirdCast’s Lights Out periods, March 1 to June 15 and August 15 to November 30, switch off, dim or shield nonessential lighting from dusk to dawn. Keep the lights you need for safety.